Grafton County, New Hampshire
Grafton County has 39 towns on this site, with about 93,000 people between them. The county seat is Haverhill. It is part of the Lebanon-Claremont, NH-VT micropolitan area. Home prices across the county are up 31% from 2022 to 2025.
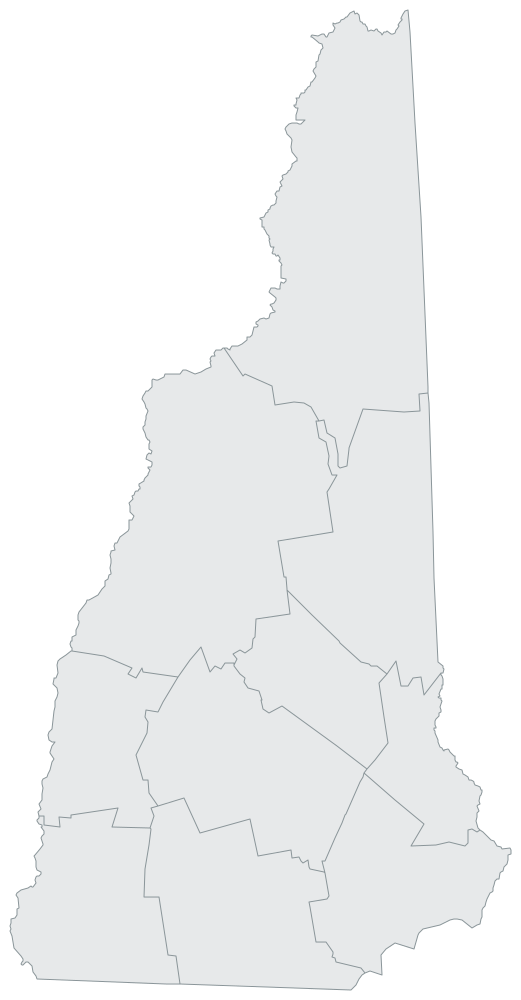
- Towns on this site
- 39
- People in these towns
- 93,225Census Bureau estimates, 2025. The listed towns only, not the whole county
- County seat
- Haverhill
- County home prices
- Up 31%2022 to 2025, FHFA county house price index, 2025
- Everyday prices
- 0.5% above U.S. averageIn the parts of New Hampshire outside metro areas; housing 6% below. BEA Regional Price Parities, 2024
- Rural-urban code
- 5 of 9Outside any metro area, with 20,000 or more people in its towns, not next to a metro area (1 is the biggest metro areas, 9 the most rural counties). USDA rural-urban codes, 2023
- Nearest big metro
- BostonAbout 95 miles from the closest town here, straight line
These lists count towns of 1,000 or more people; the table below has every town.
Closest to a big city
- Bristol95 miles to Boston
- Bridgewater97 miles to Boston
- Alexandria98 miles to Boston
Straight-line miles to a metro area of about 1 million people or more.
Lowest home values
Typical value of an owner-occupied home, Census survey 2020-2024.
Growing fastest
Census Bureau estimates, 2020 to 2025.
Every town in Grafton County
Select a column heading to sort. Miles are straight-line. Home values and incomes: Census survey 2020-2024; population: Census Bureau estimates, 2025.
| Town | People | Since 2020 | Typical home | Household income | Miles to a big city | Miles to an ER |
|---|---|---|---|---|---|---|
| Lebanon | 15,481 | +8.2% | $385,400 | $98,147 | 109 | In town |
| Hanover | 12,054 | +1.5% | $824,900 | $169,583 | 112 | 7 |
| Plymouth | 6,721 | +0.3% | $292,400 | $77,027 | 103 | In town |
| Littleton | 6,003 | +0.1% | $282,900 | $56,746 | 144 | In town |
| Haverhill | 4,667 | +1.7% | $247,900 | $85,929 | 130 | In town |
| Enfield | 4,470 | +0.4% | $390,800 | $95,474 | 104 | 7 |
| Canaan | 3,833 | +1.1% | $254,000 | $81,583 | 107 | 11 |
| Campton | 3,436 | +2.6% | $356,300 | $118,870 | 108 | 6 |
| Bristol | 3,251 | -0.3% | $258,300 | $78,438 | 95 | 9 |
| Thornton | 2,895 | +6.9% | $351,900 | $90,022 | 115 | 14 |
| Bethlehem | 2,575 | +2.5% | $288,300 | $85,029 | 136 | 12 |
| Holderness | 2,024 | +0.9% | $363,100 | $107,863 | 102 | 6 |
| Ashland | 1,943 | +0.2% | $227,000 | $54,607 | 101 | 3 |
| Alexandria | 1,740 | -2% | $323,300 | $89,194 | 98 | 12 |
| Lyme | 1,715 | -1.5% | $645,000 | $133,906 | 116 | 15 |
| Lincoln | 1,664 | +2.1% | $342,000 | 125 | 18 | |
| Lisbon | 1,626 | +0.1% | $198,000 | $65,500 | 138 | 5 |
| Rumney | 1,479 | -0.9% | $309,800 | $79,444 | 110 | 7 |
| Woodstock | 1,439 | +0.4% | $320,100 | $85,667 | 120 | 17 |
| Grafton | 1,411 | +2.1% | $267,300 | $81,563 | 98 | 11 |
| Orford | 1,229 | -0.9% | $271,900 | $92,571 | 118 | 18 |
| Bridgewater | 1,185 | +2.2% | $398,600 | $82,361 | 97 | 7 |
| Franconia | 1,143 | +5.3% | $530,300 | $87,292 | 131 | 14 |
| Bath | 1,112 | +3.2% | $234,400 | $67,813 | 136 | 4 |
| Monroe | 861 | +0.2% | $312,700 | $88,150 | 144 | 8 |
| Wentworth | 840 | -0.7% | $304,500 | $97,708 | 115 | 13 |
| Warren | 823 | -0.8% | $237,200 | $62,981 | 120 | 15 |
| Piermont | 763 | -1% | $341,600 | $80,000 | 123 | 12 |
| Sugar Hill | 687 | +5.9% | $639,700 | $154,091 | 136 | 7 |
| Hebron | 657 | +3.5% | $589,500 | $91,071 | 101 | 7 |
| Groton | 589 | +3.7% | $269,000 | $85,625 | 105 | 9 |
| Lyman | 579 | -1.2% | $311,100 | $71,042 | 140 | 7 |
| Waterville Valley | 515 | +1.6% | $562,500 | $105,625 | 113 | 17 |
| Landaff | 438 | -1.1% | $279,300 | $87,500 | 133 | 7 |
| Benton | 357 | -3.5% | $288,300 | $67,895 | 124 | 11 |
| Dorchester | 342 | +1.5% | 109 | 15 | ||
| Easton | 298 | +2.8% | $426,100 | $106,250 | 128 | 12 |
| Orange | 288 | +2.5% | $302,600 | $118,750 | 103 | 13 |
| Ellsworth | 92 | same | 115 | 11 |
Big city: a metro area of about 1 million people or more. ER: the nearest hospital with an emergency room (Medicare hospital data). Towns here are incorporated places of up to 75,000 people and unincorporated communities of 250 or more; bigger cities and smaller places are not listed.
Across Grafton County
Each part says whether its figures are for the whole county or counted from the towns listed above.
Jobs
Grafton County, 2025: 2.7% unemployed (New Hampshire 3.2%, U.S. 4.3%). In 2020 it was 5.9% (New Hampshire 6.7%). Labor force: 49,159 people, up 3.7% since 2020.
2019 to 2025Figures for the whole county, not any one town. Annual averages, not seasonally adjusted. The 2025 figures average 11 months: BLS has no October 2025 data because of the federal government shutdown. 2020 was the pandemic year, so most counties show a big drop since then. U.S. rate from the BLS Current Population Survey.
Sources: BLS Local Area Unemployment Statistics, 2025; BLS Current Population Survey, 2025.
Doctors
Part of Grafton County is a federal primary care shortage area for low-income residents. HRSA scores the need 15 on a scale of 0 to 25 (higher means greater need). 11 of the 39 towns listed here have a designation of their own; see each town's page.
A shortage area is where HRSA counts too few primary care providers for the people there; the designation helps the area recruit doctors through federal programs. Status as of November 2026.
Source: HRSA shortage areas, November 2026.
Natural hazards
FEMA rates Grafton County's overall natural hazard risk Relatively Moderate, higher than about 82% of U.S. counties. Largest expected yearly losses in the county: inland flooding, hurricane and cold wave. FEMA rates the county's social vulnerability Relatively Low and community resilience Relatively High.
County figures from FEMA's National Risk Index (version 1.20), not measurements for any one town. The ratings compare counties and are meant for planning.
Wildfire
Wildfire likelihood across Grafton County: Low, equal to or higher than about 9% of U.S. counties. Risk to homes: Low, equal to or higher than about 9% of U.S. counties. Of the county's buildings, 78% sit next to flammable vegetation, 21% could be reached by embers or fire spreading from home to home, and 1% have little exposure. The Forest Service doesn't rank 38 of the towns here on their own, so their pages show these county figures. Wildfire likelihood for Lebanon, which is rated on its own, compared with U.S. communities: Low.
A rank is the share of places with the same or a lower value. Classes come from the percentile rank: Low under 40, Medium 40 to 70, High 70 to 90, Very High 90 and up.
Source: USDA Forest Service, Wildfire Risk to Communities, 2026.
Libraries
28 of the 39 towns listed here have a public library in town: 32 libraries in all, central and branch.
Counts the towns on this site only, not libraries elsewhere in the county.
Airports
Nearest commercial airport to a town here: Lebanon Municipal Airport (FAA code LEB) in Lebanon, NH, 2.6 miles from Lebanon: nonprimary commercial service, 9,304 passenger boardings in 2025. An airport in that category may have little or no airline service. Nearest large or medium hub: General Edward Lawrence Logan International Airport (FAA code BOS) in Boston, MA, 94 miles from Bristol: large hub, 21,021,153 passenger boardings in 2025.
Straight-line miles from the closest town on this site.
Sources: FAA passenger boardings, calendar year 2025; FAA airport data (NASR), 2026-10-29 cycle.
Nearby counties
Counties that share a town with Grafton County or hold its towns' nearest neighbors.
- Orange CountyVermont, 17 towns
- Belknap County11 towns
- Caledonia CountyVermont, 17 towns
- Carroll County18 towns
- Merrimack County27 towns
- Sullivan County15 towns
- Coos County20 towns
- Windsor CountyVermont, 24 towns
Sources: Census Bureau population estimates, 2025; Census Bureau American Community Survey, 2020-2024; Census Bureau Gazetteer, 2025; Census Bureau boundary files, 2025; OMB metro and micro areas, 2023; FHFA county house price index, 2025; BEA Regional Price Parities, 2024; USDA rural-urban codes, 2023; Medicare hospital data, October 2026; BLS Local Area Unemployment Statistics, 2025; BLS Current Population Survey, 2025; HRSA shortage areas, November 2026; FEMA National Risk Index, December 2025; USDA Forest Service, Wildfire Risk to Communities, 2026; IMLS Public Libraries Survey, fiscal year 2024; FAA passenger boardings, calendar year 2025; FAA airport data (NASR), 2026-10-29 cycle. Compiled by Small Town Guide.