Riverside County, California
Riverside County has 50 towns on this site, with about 427,000 people between them. It is part of the Riverside-San Bernardino-Ontario, CA metropolitan area. Home prices across the county are up 11% from 2022 to 2025.
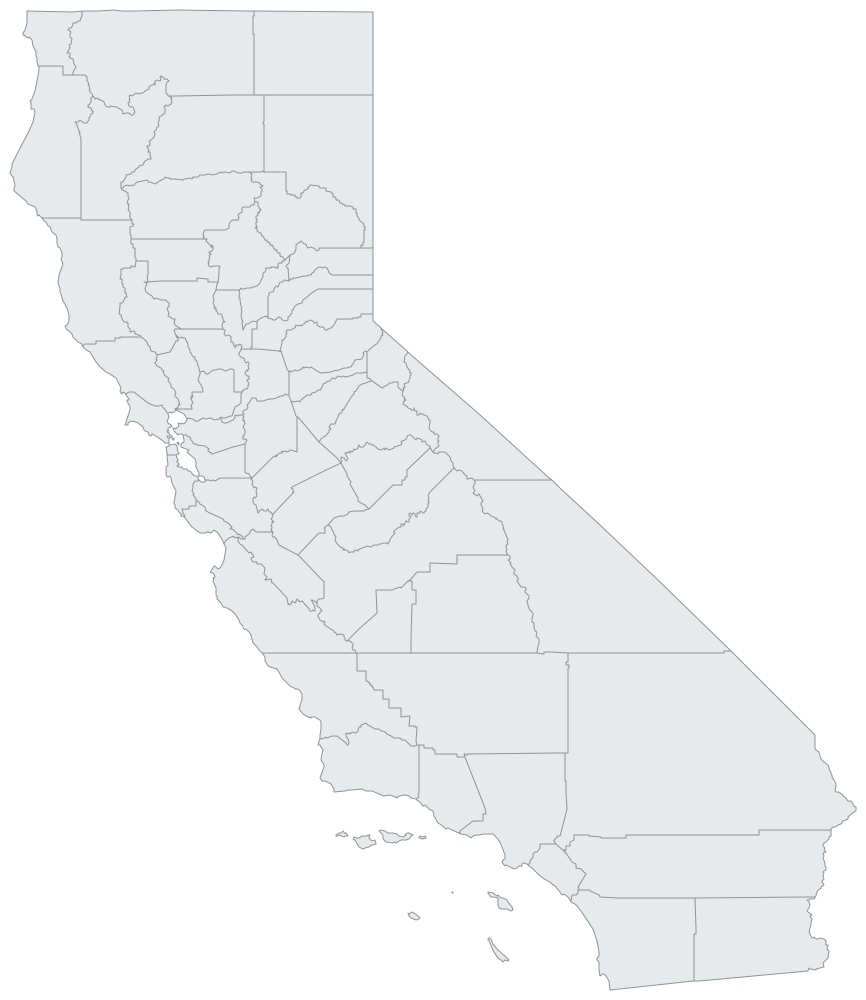
- Towns on this site
- 50
- People in these towns
- 426,640Census Bureau estimates, 2025, for incorporated towns; Census survey, 2020-2024, for unincorporated communities. The listed towns only, not the whole county
- County home prices
- Up 11%2022 to 2025, FHFA county house price index, 2025
- Everyday prices
- 6.4% above U.S. averageIn the Riverside-San Bernardino-Ontario metro area; housing 29% above. BEA Regional Price Parities, 2024
- Rural-urban code
- 1 of 9In a metro area of 1 million people or more (1 is the biggest metro areas, 9 the most rural counties). USDA rural-urban codes, 2023
- Nearest big metro
- RiversideAbout 4 miles from the closest town here, straight line
These lists count towns of 1,000 or more people; the table below has every town.
Closest to a big city
- Meadowbrook16 miles to Riverside
- Winchester24 miles to Riverside
- Cabazon35 miles to Riverside
Straight-line miles to a metro area of about 1 million people or more.
Lowest home values
- Oasis$34,800
- Desert Edge$76,300
- Mesa Verde$110,100
Typical value of an owner-occupied home, Census survey 2020-2024.
Growing fastest
- Desert Hot Springsup 4% since 2020
- Palm Desertup 4% since 2020
- Palm Springsup 2% since 2020
Census Bureau estimates, 2020 to 2025.
Every town in Riverside County
Select a column heading to sort. Miles are straight-line. Home values and incomes: Census survey 2020-2024; population: Census Bureau estimates, 2025, for incorporated towns; Census survey, 2020-2024, for unincorporated communities.
| Town | People | Since 2020 | Typical home | Household income | Miles to a big city | Miles to an ER |
|---|---|---|---|---|---|---|
| Palm Desert | 53,259 | +4% | $542,000 | $77,513 | 61 | 4 |
| Palm Springs | 45,315 | +1.5% | $604,000 | $73,119 | 50 | In town |
| Desert Hot Springs | 34,009 | +4.5% | $354,800 | $52,761 | 49 | 8 |
| Mead Valley suburb | 19,286 | $446,200 | $86,795 | 10 | 7 | |
| Valle Vista suburb | 18,602 | $336,200 | $66,825 | 32 | 4 | |
| Rancho Mirage suburb | 17,876 | +4.9% | $807,200 | $107,364 | 57 | In town |
| Woodcrest suburb | 17,368 | $786,300 | $153,731 | 4 | 5 | |
| Blythe | 15,042 | -15.6% | $225,000 | $56,625 | 146 | 35 |
| El Sobrante (Riverside County) suburb | 13,129 | $836,300 | $165,682 | 6 | 2 | |
| Lakeland Village suburb | 12,236 | $463,500 | $85,748 | 20 | 12 | |
| Canyon Lake suburb | 11,113 | +0.3% | $699,600 | $126,926 | 19 | 6 |
| Calimesa suburb | 11,111 | +8.8% | $446,300 | $87,181 | 20 | 7 |
| Home Gardens suburb | 10,506 | $538,700 | $96,342 | 8 | 3 | |
| Good Hope suburb | 8,816 | $391,700 | $56,981 | 13 | 7 | |
| Highgrove suburb | 8,366 | $625,800 | $114,125 | 7 | 4 | |
| Bermuda Dunes suburb | 7,971 | $596,300 | $90,818 | 65 | 4 | |
| Thousand Palms suburb | 7,720 | $268,700 | $77,000 | 60 | 6 | |
| Homeland suburb | 7,584 | $238,200 | $60,404 | 21 | 4 | |
| Garnet | 7,382 | $267,900 | $72,694 | 52 | 7 | |
| Mecca | 7,184 | $224,300 | $48,312 | 80 | 13 | |
| Nuevo suburb | 6,803 | $535,900 | $112,857 | 17 | 6 | |
| Cherry Valley suburb | 6,668 | $408,000 | $76,895 | 24 | 4 | |
| Desert Palms suburb | 6,579 | $567,400 | $79,792 | 64 | 6 | |
| Lake Mathews suburb | 6,527 | $760,900 | $94,444 | 8 | 8 | |
| El Cerrito suburb | 5,325 | $627,400 | $108,882 | 10 | 4 | |
| Indian Wells suburb | 4,992 | +4.4% | $1,078,200 | $162,990 | 63 | 6 |
| Winchester | 4,555 | $493,500 | $79,250 | 24 | 5 | |
| Oasis | 4,051 | $34,800 | $38,769 | 75 | 14 | |
| Idyllwild-Pine Cove | 3,957 | $532,400 | $73,678 | 40 | 13 | |
| Sage | 3,781 | $569,300 | $119,938 | 37 | 11 | |
| Desert Edge | 3,778 | $76,300 | $37,429 | 55 | 8 | |
| North Shore | 3,515 | $203,900 | $51,795 | 84 | 23 | |
| Green Acres suburb | 3,382 | $79,855 | 23 | 5 | ||
| Coronita suburb | 2,763 | $597,400 | $111,932 | 13 | 3 | |
| Meadowbrook | 2,627 | $56,212 | 16 | 7 | ||
| Vista Santa Rosa | 2,333 | $427,700 | $70,474 | 71 | 6 | |
| Romoland suburb | 2,268 | $523,400 | $106,861 | 18 | 3 | |
| Sky Valley | 2,255 | $51,190 | 60 | 10 | ||
| Lakeview suburb | 2,062 | $548,800 | 17 | 6 | ||
| Anza | 1,898 | $346,600 | 48 | 20 | ||
| Cabazon | 1,887 | $270,400 | 35 | 10 | ||
| Thermal suburb | 1,800 | $187,000 | 76 | 8 | ||
| Warm Springs suburb | 1,673 | $329,100 | 16 | 10 | ||
| March ARB suburb | 1,273 | 7 | 5 | |||
| Lake Riverside | 1,262 | $430,800 | $128,636 | 44 | 17 | |
| Whitewater | 1,181 | $299,400 | $77,898 | 40 | 11 | |
| Indio Hills | 1,117 | $337,100 | 66 | 9 | ||
| Mesa Verde | 1,016 | $110,100 | $51,188 | 148 | 42 | |
| Aguanga | 961 | 46 | 15 | |||
| Ripley | 476 | $28,775 | 148 | 43 |
Big city: a metro area of about 1 million people or more. ER: the nearest hospital with an emergency room (Medicare hospital data). Towns here are incorporated places of up to 75,000 people and unincorporated communities of 250 or more; bigger cities and smaller places are not listed.
Across Riverside County
Each part says whether its figures are for the whole county or counted from the towns listed above.
Jobs
Riverside County, 2025: 5.6% unemployed (California 5.5%, U.S. 4.3%). In 2020 it was 10.2% (California 10.1%). Labor force: 1,207,196 people, up 9.7% since 2020.
2019 to 2025Figures for the whole county, not any one town. Annual averages, not seasonally adjusted. The 2025 figures average 11 months: BLS has no October 2025 data because of the federal government shutdown. 2020 was the pandemic year, so most counties show a big drop since then. U.S. rate from the BLS Current Population Survey.
Sources: BLS Local Area Unemployment Statistics, 2025; BLS Current Population Survey, 2025.
Doctors
Part of Riverside County is a federal primary care shortage area. HRSA scores the need 14 on a scale of 0 to 25 (higher means greater need).
A shortage area is where HRSA counts too few primary care providers for the people there; the designation helps the area recruit doctors through federal programs. Status as of November 2026.
Source: HRSA shortage areas, November 2026.
Natural hazards
FEMA rates Riverside County's overall natural hazard risk Very High, higher than more than 99% of U.S. counties. Largest expected yearly losses in the county: inland flooding, earthquake and wildfire. FEMA rates the county's social vulnerability Relatively Low and community resilience Very Low.
County figures from FEMA's National Risk Index (version 1.20), not measurements for any one town. The ratings compare counties and are meant for planning.
Wildfire
Wildfire likelihood in the 50 towns listed here, each compared with U.S. communities: 3 Low, 13 Medium, 6 High and 28 Very High.
Classes come from the percentile rank: Low under 40, Medium 40 to 70, High 70 to 90, Very High 90 and up.
Source: USDA Forest Service, Wildfire Risk to Communities, 2026.
Libraries
19 of the 50 towns listed here have a public library in town: 19 libraries in all, central and branch.
Counts the towns on this site only, not libraries elsewhere in the county.
Airports
Nearest commercial airport to a town here: Palm Springs International Airport (FAA code PSP) in Palm Springs, CA, 2.6 miles from Palm Springs: small hub, 1,654,109 passenger boardings in 2025. Nearest large or medium hub: Ontario International Airport (FAA code ONT) in Ontario, CA, 12 miles from Coronita: medium hub, 3,473,874 passenger boardings in 2025.
Straight-line miles from the closest town on this site.
Sources: FAA passenger boardings, calendar year 2025; FAA airport data (NASR), 2026-10-29 cycle.
Nearby counties
Counties that share a town with Riverside County or hold its towns' nearest neighbors.
- San Bernardino County31 towns
- La Paz CountyArizona, 12 towns
- Orange County13 towns
- Imperial County12 towns
- San Diego County33 towns
Sources: Census Bureau population estimates, 2025; Census Bureau American Community Survey, 2020-2024; Census Bureau Gazetteer, 2025; Census Bureau boundary files, 2025; OMB metro and micro areas, 2023; FHFA county house price index, 2025; BEA Regional Price Parities, 2024; USDA rural-urban codes, 2023; Medicare hospital data, October 2026; BLS Local Area Unemployment Statistics, 2025; BLS Current Population Survey, 2025; HRSA shortage areas, November 2026; FEMA National Risk Index, December 2025; USDA Forest Service, Wildfire Risk to Communities, 2026; IMLS Public Libraries Survey, fiscal year 2024; FAA passenger boardings, calendar year 2025; FAA airport data (NASR), 2026-10-29 cycle. Compiled by Small Town Guide.