Allegheny County, Pennsylvania
Allegheny County has 104 towns on this site, with about 391,000 people between them. It is part of the Pittsburgh, PA metropolitan area. Home prices across the county are up 14% from 2022 to 2025.
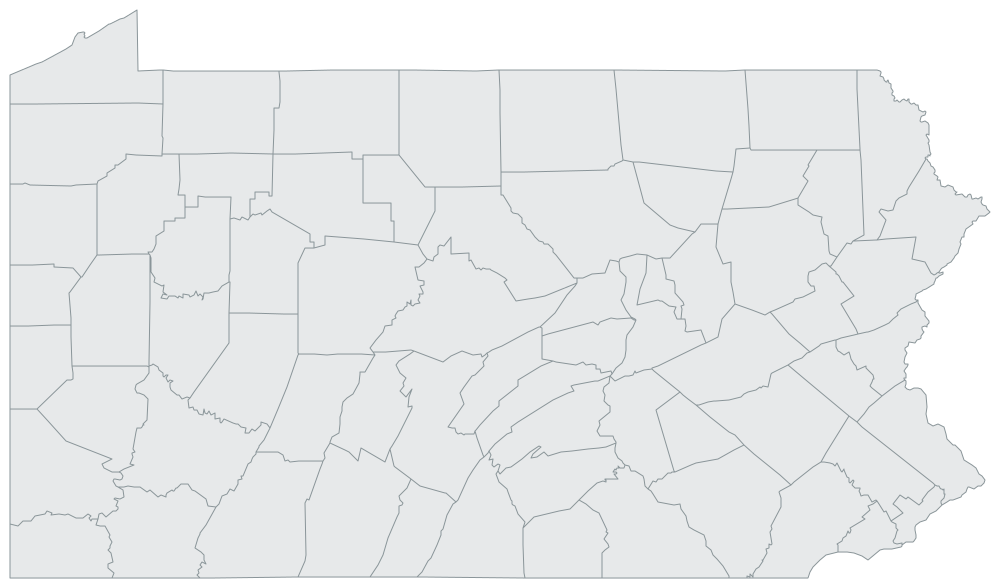
- Towns on this site
- 104Plus 2 towns mainly in a neighboring county
- People in these towns
- 391,345Census Bureau estimates, 2025, for incorporated towns; Census survey, 2020-2024, for unincorporated communities. The listed towns only, not the whole county
- County home prices
- Up 14%2022 to 2025, FHFA county house price index, 2025
- Everyday prices
- 5.3% below U.S. averageIn the Pittsburgh metro area; housing 28% below. BEA Regional Price Parities, 2024
- Rural-urban code
- 1 of 9In a metro area of 1 million people or more (1 is the biggest metro areas, 9 the most rural counties). USDA rural-urban codes, 2023
- Nearest big metro
- PittsburghAbout 2 miles from the closest town here, straight line
Every town in Allegheny County
Select a column heading to sort. Miles are straight-line. Home values and incomes: Census survey 2020-2024; population: Census Bureau estimates, 2025, for incorporated towns; Census survey, 2020-2024, for unincorporated communities.
| Town | People | Since 2020 | Typical home | Household income | Miles to a big city | Miles to an ER |
|---|---|---|---|---|---|---|
| West Mifflin suburb | 18,707 | -4.4% | $151,600 | $76,563 | 7 | 3 |
| McKeesport suburb | 16,907 | -4.5% | $72,700 | $34,219 | 10 | In town |
| Franklin Park suburb | 14,978 | -3.3% | $485,600 | $176,875 | 12 | 4 |
| Whitehall suburb | 14,521 | -3.4% | $236,200 | $89,404 | 6 | 4 |
| Wilkinsburg suburb | 13,602 | -4.7% | $155,500 | $46,416 | 5 | 3 |
| Carnot-Moon suburb | 13,534 | $264,200 | $100,714 | 14 | 3 | |
| Jefferson Hills suburb | 12,357 | -0.6% | $315,900 | $116,064 | 10 | In town |
| Munhall suburb | 10,253 | -4.7% | $132,100 | $52,517 | 5 | 4 |
| Brentwood suburb | 9,597 | -4.8% | $148,400 | $68,904 | 5 | 4 |
| Glenshaw suburb | 9,139 | $249,500 | $92,864 | 7 | 3 | |
| Pleasant Hills suburb | 8,212 | -3.1% | $244,800 | $102,167 | 8 | 1.5 |
| Swissvale suburb | 8,197 | -4.8% | $147,000 | $60,341 | 5 | 4 |
| Castle Shannon suburb | 8,006 | -3.4% | $190,300 | $64,071 | 6 | 3 |
| Bellevue suburb | 7,888 | -4.8% | $213,300 | $68,827 | 6 | 4 |
| Dormont suburb | 7,816 | -4.9% | $221,800 | $80,526 | 5 | 1.8 |
| Carnegie suburb | 7,777 | -4.3% | $171,500 | $67,656 | 6 | 2 |
| White Oak suburb | 7,286 | -4.5% | $162,200 | $59,452 | 12 | 3 |
| Natrona Heights suburb | 6,903 | $160,000 | $69,710 | 18 | 0.7 | |
| Oakmont suburb | 6,576 | -2.8% | $334,500 | $92,782 | 9 | 4 |
| West View suburb | 6,355 | -4.8% | $227,100 | $84,063 | 6 | 4 |
| Forest Hills suburb | 6,116 | -4.8% | $200,700 | $89,688 | 6 | 5 |
| Clairton suburb | 5,876 | -4.8% | $66,500 | $36,538 | 11 | 3 |
| Crafton suburb | 5,790 | -4.8% | $201,000 | $64,006 | 5 | 4 |
| McKees Rocks suburb | 5,624 | -4.7% | $75,600 | $41,131 | 5 | 3 |
| Coraopolis suburb | 5,280 | -4.8% | $169,700 | $63,828 | 11 | 2 |
| Fox Chapel suburb | 5,139 | -3.7% | $900,600 | $243,625 | 7 | 3 |
| Duquesne suburb | 5,019 | -4.3% | $63,800 | $44,180 | 8 | 1.5 |
| Turtle Creek suburb | 4,865 | -4.8% | $84,900 | $45,997 | 8 | 4 |
| Green Tree suburb | 4,672 | -4.6% | $251,900 | $92,422 | 4 | 3 |
| Avalon suburb | 4,572 | -4.7% | $170,500 | $51,250 | 6 | 5 |
| Bridgeville suburb | 4,569 | -4.7% | $166,400 | $59,981 | 9 | 3 |
| Glassport suburb | 4,251 | -4.8% | $82,700 | $47,803 | 9 | 3 |
| Tarentum suburb | 4,127 | -4.8% | $84,300 | $45,167 | 16 | 1.5 |
| North Braddock suburb | 4,107 | -4.8% | $66,100 | $34,564 | 7 | 3 |
| Sewickley suburb | 3,729 | -4.4% | $464,300 | $101,053 | 13 | In town |
| Port Vue suburb | 3,519 | -4% | $82,500 | $58,194 | 9 | 1.6 |
| Etna suburb | 3,269 | -4.7% | $135,800 | $53,654 | 4 | 2 |
| Springdale suburb | 3,234 | -4.7% | $153,900 | $65,893 | 12 | 6 |
| Ingram suburb | 3,222 | -4.9% | $156,800 | $71,154 | 5 | 4 |
| Mount Oliver suburb | 3,222 | -4.8% | $96,900 | $52,297 | 2 | 2 |
| Millvale suburb | 3,211 | -4.5% | $124,100 | $72,778 | 3 | 2 |
| Brackenridge suburb | 3,093 | -4.6% | $94,800 | $50,197 | 17 | 0.7 |
| Churchill suburb | 3,014 | -4.8% | $234,800 | $106,964 | 7 | 4 |
| Imperial suburb | 3,001 | $198,300 | $71,489 | 14 | 7 | |
| Edgewood suburb | 2,997 | -4.2% | $327,400 | $103,203 | 5 | 4 |
| Sharpsburg suburb | 2,990 | -4.8% | $141,400 | $59,228 | 5 | 1.4 |
| Pitcairn suburb | 2,953 | -4.8% | $59,300 | $36,419 | 11 | 1.9 |
| Gibsonia suburb | 2,899 | $347,900 | $139,226 | 13 | 5 | |
| Homestead suburb | 2,822 | -2.1% | $83,900 | $39,052 | 4 | 3 |
| Aspinwall suburb | 2,809 | -4.8% | $378,800 | $107,000 | 5 | 0.5 |
| Bakerstown suburb | 2,527 | $544,400 | $164,330 | 15 | 7 | |
| Verona suburb | 2,396 | -4.8% | $145,200 | $48,733 | 8 | 3 |
| Emsworth suburb | 2,377 | -4.8% | $184,200 | $64,816 | 8 | 5 |
| Liberty suburb | 2,242 | -4.8% | $115,600 | $73,786 | 10 | 2 |
| Rankin suburb | 1,975 | +4.5% | $95,000 | $48,145 | 5 | 4 |
| East McKeesport suburb | 1,969 | -4.8% | $101,100 | $65,907 | 10 | 3 |
| East Pittsburgh suburb | 1,835 | -4.7% | $38,561 | 8 | 3 | |
| Ben Avon suburb | 1,824 | -4.9% | $344,700 | $102,869 | 7 | 5 |
| Greenock suburb | 1,815 | $147,200 | $52,348 | 13 | 4 | |
| West Homestead suburb | 1,778 | -4.6% | $167,400 | $77,250 | 5 | 4 |
| Wilmerding suburb | 1,700 | -4.5% | $61,200 | $36,467 | 9 | 4 |
| Braddock Hills suburb | 1,650 | -4.6% | $129,800 | $39,981 | 6 | 4 |
| Braddock suburb | 1,647 | -4.2% | $37,813 | 6 | 4 | |
| Edgeworth suburb | 1,611 | -3.8% | $820,100 | $202,813 | 14 | 1 |
| Cheswick suburb | 1,594 | -4.6% | $196,200 | $75,000 | 12 | 6 |
| Dravosburg suburb | 1,536 | -4.6% | $93,500 | $51,715 | 8 | 2 |
| Sturgeon suburb | 1,466 | $220,500 | 13 | 8 | ||
| Bell Acres | 1,454 | -3.4% | $437,500 | $165,987 | 15 | 3 |
| Oakdale suburb | 1,413 | -4.4% | $190,700 | $93,036 | 11 | 7 |
| Glendale suburb | 1,408 | $160,000 | $76,359 | 7 | 2 | |
| Versailles suburb | 1,406 | -4.9% | $97,100 | $42,500 | 11 | 3 |
| Blawnox suburb | 1,384 | -4.8% | $173,000 | $60,333 | 7 | 2 |
| Elizabeth suburb | 1,343 | -3.9% | $108,300 | $51,174 | 13 | 4 |
| Russellton suburb | 1,333 | $241,300 | $71,786 | 14 | 5 | |
| Heidelberg suburb | 1,230 | -4.8% | $150,200 | $67,829 | 7 | 1.7 |
| Bradford Woods suburb | 1,126 | -4.6% | $508,300 | $153,125 | 15 | 1.1 |
| Whitaker suburb | 1,123 | -4.8% | $98,500 | $63,194 | 5 | 4 |
| Leetsdale suburb | 1,102 | -4.5% | $156,000 | $66,346 | 15 | 2 |
| Rennerdale suburb | 1,067 | $325,300 | $120,167 | 9 | 4 | |
| Enlow suburb | 1,019 | $284,500 | $111,250 | 13 | 7 | |
| Curtisville suburb | 989 | $162,100 | 16 | 6 | ||
| Dorseyville suburb | 941 | $364,000 | 11 | 6 | ||
| Clinton suburb | 899 | $104,659 | 17 | 7 | ||
| Harwick suburb | 899 | $134,800 | $60,179 | 12 | 6 | |
| Lincoln | 888 | -4.4% | $135,200 | $73,750 | 12 | 4 |
| Natrona suburb | 869 | 18 | In town | |||
| Sewickley Heights | 827 | -3.6% | $1,062,500 | $203,214 | 12 | 1.8 |
| Chalfant suburb | 710 | -4.8% | $120,000 | $59,120 | 7 | 4 |
| Bairdford suburb | 706 | $172,700 | $68,929 | 14 | 8 | |
| Sewickley Hills | 681 | -1.6% | $486,400 | $175,000 | 12 | 3 |
| Pennsbury Village suburb | 644 | -4.6% | $157,100 | $69,167 | 7 | 4 |
| Noblestown suburb | 616 | $469,400 | 12 | 7 | ||
| Blaine Hill suburb | 587 | $158,000 | 13 | 4 | ||
| Glen Osborne suburb | 558 | -4.8% | $581,700 | $136,000 | 12 | 1.1 |
| Wall suburb | 493 | -4.6% | $53,000 | $54,063 | 11 | 3 |
| West Wilmerding suburb | 475 | $126,000 | 9 | 3 | ||
| Thornburg suburb | 447 | -4.9% | $469,100 | $231,250 | 6 | 4 |
| Rosslyn Farms suburb | 419 | -4.8% | $446,200 | 6 | 3 | |
| Industry (Allegheny County) | 406 | $110,800 | 15 | 7 | ||
| West Elizabeth suburb | 385 | -4.2% | $82,100 | $55,000 | 12 | 4 |
| Ben Avon Heights suburb | 376 | -5.1% | $542,500 | $234,375 | 7 | 5 |
| Buena Vista suburb | 301 | $47,600 | $36,563 | 15 | 6 | |
| Glenfield suburb | 200 | -4.8% | $165,400 | $98,750 | 10 | 3 |
| Haysville suburb | 77 | -4.9% | 11 | 1.7 |
Big city: a metro area of about 1 million people or more. ER: the nearest hospital with an emergency room (Medicare hospital data). Towns here are incorporated places of up to 75,000 people and unincorporated communities of 250 or more; bigger cities and smaller places are not listed.
Also reaching into Allegheny County: McDonald (mainly in Washington County) and Trafford (mainly in Westmoreland County).
Across Allegheny County
Each part says whether its figures are for the whole county or counted from the towns listed above.
Jobs
Allegheny County, 2025: 4.0% unemployed (Pennsylvania 4.3%, U.S. 4.3%). In 2020 it was 8.7% (Pennsylvania 8.8%). Labor force: 644,206 people, down 1.9% since 2020.
2019 to 2025Figures for the whole county, not any one town. Annual averages, not seasonally adjusted. The 2025 figures average 11 months: BLS has no October 2025 data because of the federal government shutdown. 2020 was the pandemic year, so most counties show a big drop since then. U.S. rate from the BLS Current Population Survey.
Sources: BLS Local Area Unemployment Statistics, 2025; BLS Current Population Survey, 2025.
Doctors
Part of Allegheny County is a federal primary care shortage area for low-income residents. HRSA scores the need 16 on a scale of 0 to 25 (higher means greater need).
A shortage area is where HRSA counts too few primary care providers for the people there; the designation helps the area recruit doctors through federal programs. Status as of November 2026.
Source: HRSA shortage areas, November 2026.
Natural hazards
FEMA rates Allegheny County's overall natural hazard risk Relatively High, higher than about 98% of U.S. counties. Largest expected yearly losses in the county: inland flooding, cold wave and tornado. FEMA rates the county's social vulnerability Relatively Low and community resilience Very High.
County figures from FEMA's National Risk Index (version 1.20), not measurements for any one town. The ratings compare counties and are meant for planning.
Wildfire
Wildfire likelihood in the 104 towns listed here, each compared with U.S. communities: Low for all 104.
Classes come from the percentile rank: Low under 40, Medium 40 to 70, High 70 to 90, Very High 90 and up.
Source: USDA Forest Service, Wildfire Risk to Communities, 2026.
Libraries
35 of the 104 towns listed here have a public library in town: 35 libraries in all, central and branch.
Counts the towns on this site only, not libraries elsewhere in the county.
Airports
Nearest commercial airport to a town here: Pittsburgh International Airport (FAA code PIT) in Pittsburgh, PA, 2 miles from Carnot-Moon: medium hub, 4,792,035 passenger boardings in 2025.
Straight-line miles from the closest town on this site.
Sources: FAA passenger boardings, calendar year 2025; FAA airport data (NASR), 2026-10-29 cycle.
Nearby counties
Counties that share a town with Allegheny County or hold its towns' nearest neighbors.
- Westmoreland County59 towns
- Washington County62 towns
- Beaver County34 towns
- Butler County33 towns
- Armstrong County23 towns
Sources: Census Bureau population estimates, 2025; Census Bureau American Community Survey, 2020-2024; Census Bureau Gazetteer, 2025; Census Bureau boundary files, 2025; OMB metro and micro areas, 2023; FHFA county house price index, 2025; BEA Regional Price Parities, 2024; USDA rural-urban codes, 2023; Medicare hospital data, October 2026; BLS Local Area Unemployment Statistics, 2025; BLS Current Population Survey, 2025; HRSA shortage areas, November 2026; FEMA National Risk Index, December 2025; USDA Forest Service, Wildfire Risk to Communities, 2026; IMLS Public Libraries Survey, fiscal year 2024; FAA passenger boardings, calendar year 2025; FAA airport data (NASR), 2026-10-29 cycle. Compiled by Small Town Guide.